
Which College Institutions Are ‘Too Big to Fail’?


Executive Summary
The Academic Boardroom published its commentary in the past, “When Endowments Become Life Support, Not Legacy.” In this article, a serious financial crisis in mid-size tuition-dependent educational institutions was explained. Around 200 private, nonprofit colleges had to borrow against their restricted endowments or sell them to pay their salaries because of the demographic crisis, high tuition discounts (over 57%), and inflation. When universities use their endowment capital to cover their losses, they find themselves in a spiral that leads to closing.
Nevertheless, the trouble in higher education is not the same for all institutions. The sector is divided into two parts. While many mid-size liberal arts colleges and regional private institutions are facing financial problems, a few well-established universities are highly successful.
The briefing raises an important question related to the crisis in higher education: which institutions are too big to fail (TBTF)?
In business, TBTF is used to describe institutions that may cause a danger to the financial world if they go bankrupt. The same applies to education. TBTF institutions are not only the ones that have financial problems; they can also cease to be a source of ideas for advancements, prevent producing specialists for the labor market, and destabilize the economy.
To define TBTF institutions, a special model called the Institutional Resiliency Model was created. The study analyzed the institutions according to five criteria, giving a different percentage to each criterion: Financial Resources (35%), Impact & Innovation (30%), Prestige & Perceived Value (20%), Sustainability & Governance (10%), and Relevance & Brand Awareness (5%).
Defining Systemic Immunity in Academia
If a bank collapses, the entire economy takes notice. Imagine if a large university collapses. The consequences could be even more far-reaching—disrupting pipelines of research, leadership, and public trust. A perfect storm is brewing across the United States higher education landscape: massive program cuts as budgets become tighter, technology continuing to challenge traditional education processes, and ever-growing federal oversight of higher education. With this perfect storm approaching, an important question emerges—what colleges and universities are “too big to fail?”
While the term “too big to fail” brings about thoughts of the significant impact of major financial institutions on the world economy, this analysis reframes the term to highlight the extreme significance of certain academic institutions. By “academic institutions,” we mean colleges and universities with such great and intricate resilience that if they fail, there would be dire consequences for their academic ecosystems, the very engines of research and innovation, and society at large. This is not about needing a direct government bailout, although government funding can be as direct with large research grants and student funding for admissions.
An institutional collapse would create loss in multiple critical areas. We would create a paralyzing setback in research and innovation, as many of these top-ranked universities represent the heavyweight drivers of advances in scientific fields, technology, and medicine. Additionally, we would undermine the critical talent pipeline they create to educate a disproportionate number of future leaders, innovators, and skilled practitioners in every sector, significantly undermining the short- and long-term socio-economic health.
Ultimately, these universities are stewards of prodigious intellectual capital and global relevance; their failure is not just about the money. We are talking about an existential crisis for all the interconnected academic, scientific, and intellectual fabric we depend on for so much of our intellectual and societal contributions to progress.
In response to the initial question, this research cultivates the most resilient institutions that are so important to the academic ecosystem that if they failed, it would have catastrophic implications. Using a multifaceted model, each university, holistically, based on several factors (financial resources, prestige, popularity, impact of innovation, and elasticity to loss), captures the depth and flexibility of resources they have. The objective is to define those colleges and universities with the flexibility and depth of resources so they cannot only survive this tumultuous and uncertain time but also prosper with confidence through uncertainty.
Methodology: Measuring Resilience
This research cultivates a multi-dimensional perspective on institutional capacity and elasticity. To create a balanced and meaningful resilience ranking, each dimension was weighted as follows:
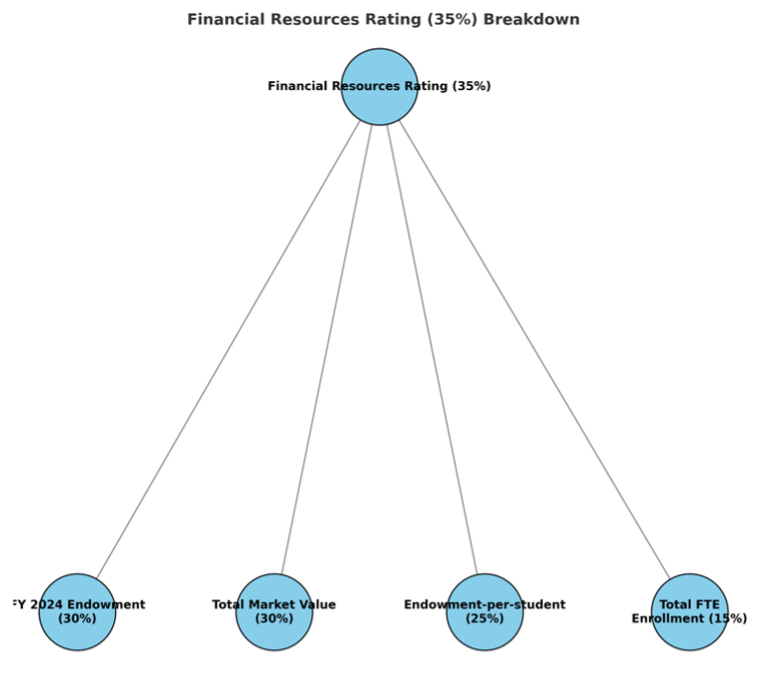
Financial Resources (35%): Endowment size, total budgets, and research funding. This variable was adjusted for the size of institutions and inflation-adjusted, with various sources of data collected from the NACUBO, IPEDS, and HERD. The Financial Resource Score derived an allocated weight to total FY 2024 endowment (30%), total market value of institutional assets (30%), endowment per student (25%), and total FTE enrollment (15%)—therefore incorporating both absolute capacity as well as investment-comparison for each student.
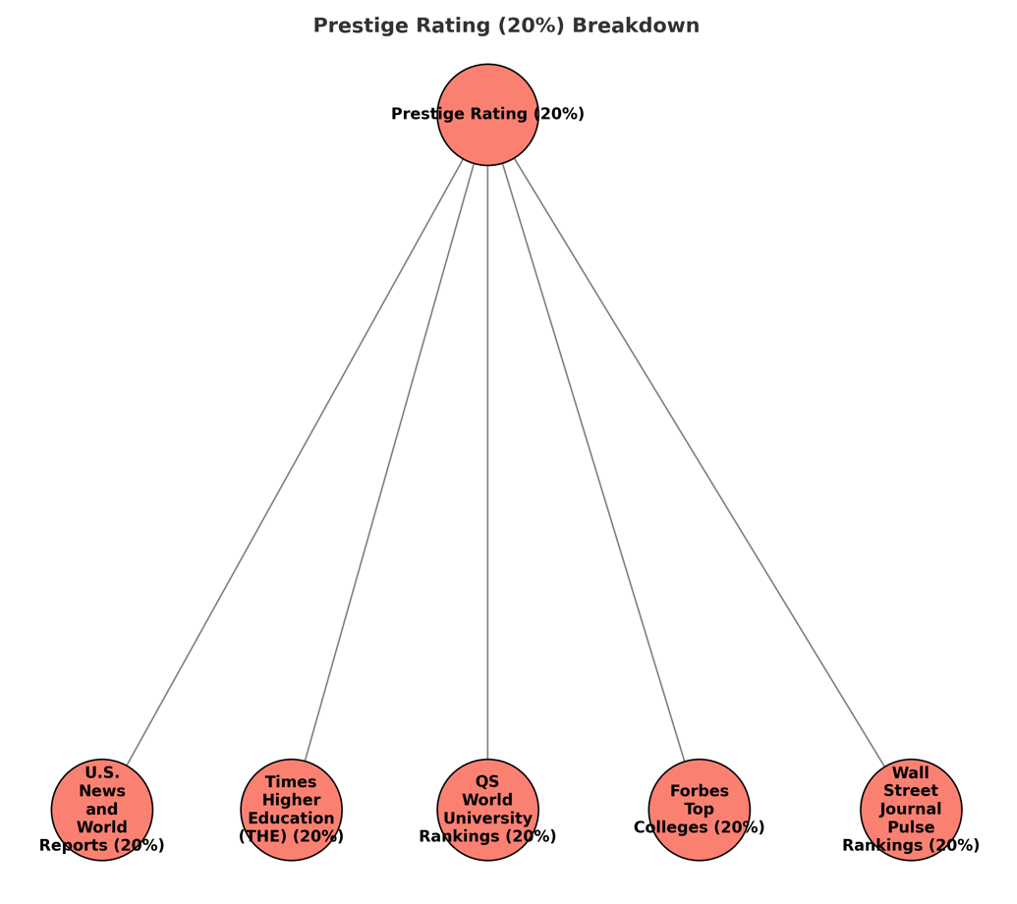
Prestige & Perceived Value (20%): Prestige was measured (equal scale) through recent global rankings of various sources including: Forbes Top Colleges, U.S. News and World Reports, Times Higher Education (THE) World University Rankings, QS World University Rankings, and The Wall Street Journal Pulse Rankings.
The Composite Prestige Score was calculated by combining five significant college ranking systems, namely, QS, Times Higher Education (THE), Wall Street Journal (WSJ), Forbes, and U.S. News & World Report. The ratings for each institution from these five sources were normalized, and average ratings were found using equal weight (20% each), which in combination offered the dual ideas of global reputation, academic quality, and public perception together in a balanced methodology. This method provides a strong, multi- source prestige metric which represents the larger context of elite higher education institutions in the United States.
Institutions with missing rating scores were adjusted to ensure fairness, using scaled maximum scores depending on how many metrics were available.
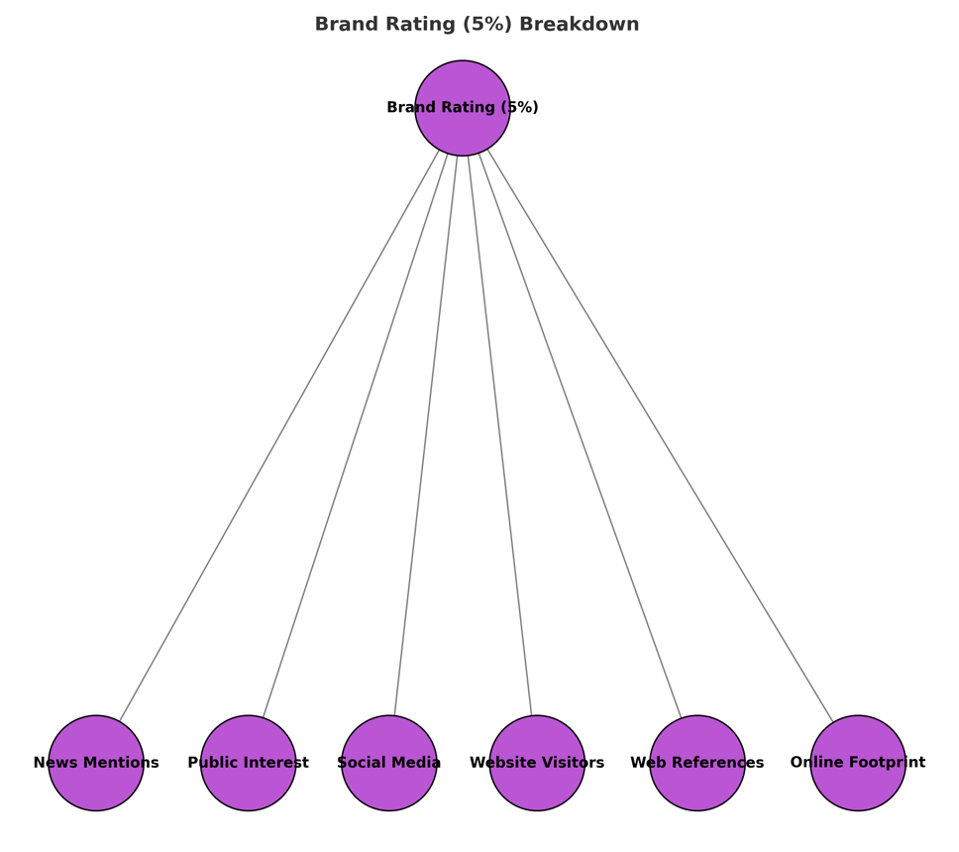
Relevancy and Notability (5%): The Brand Awareness Rating Score originates from the vanity metrics of each university’s public sentiment and media coverage (in the past 12 months), which combine seven factors: news mentions, public interest with search engines, social media followers, website visitors, web references, online footprint, and YouTube impressions.
Each score was ranked from 75.0 to 99.9, allowing institutions to be ranked without tying any scores, so there is a signal of comparative digital presence. The method highlights the universities recognized globally in the media, by the public and on the internet; the key indicators of brand strength or recognition in today’s world have either been media-based, public attention-driven, or internet-based ‘footprint.’
Impact & Innovation (30%): This measurement encompasses any patents, unique inventions, or scholarly impact (average h-index of faculty as determined by Exaly and Google Scholar). Research and development funding (e.g., NIH and NSF) and accolades (e.g., but not limited to, Nobel Prize, Rhodes Scholar, Guggenheim, Fulbright, and MacArthur) are measured highly in this variable.
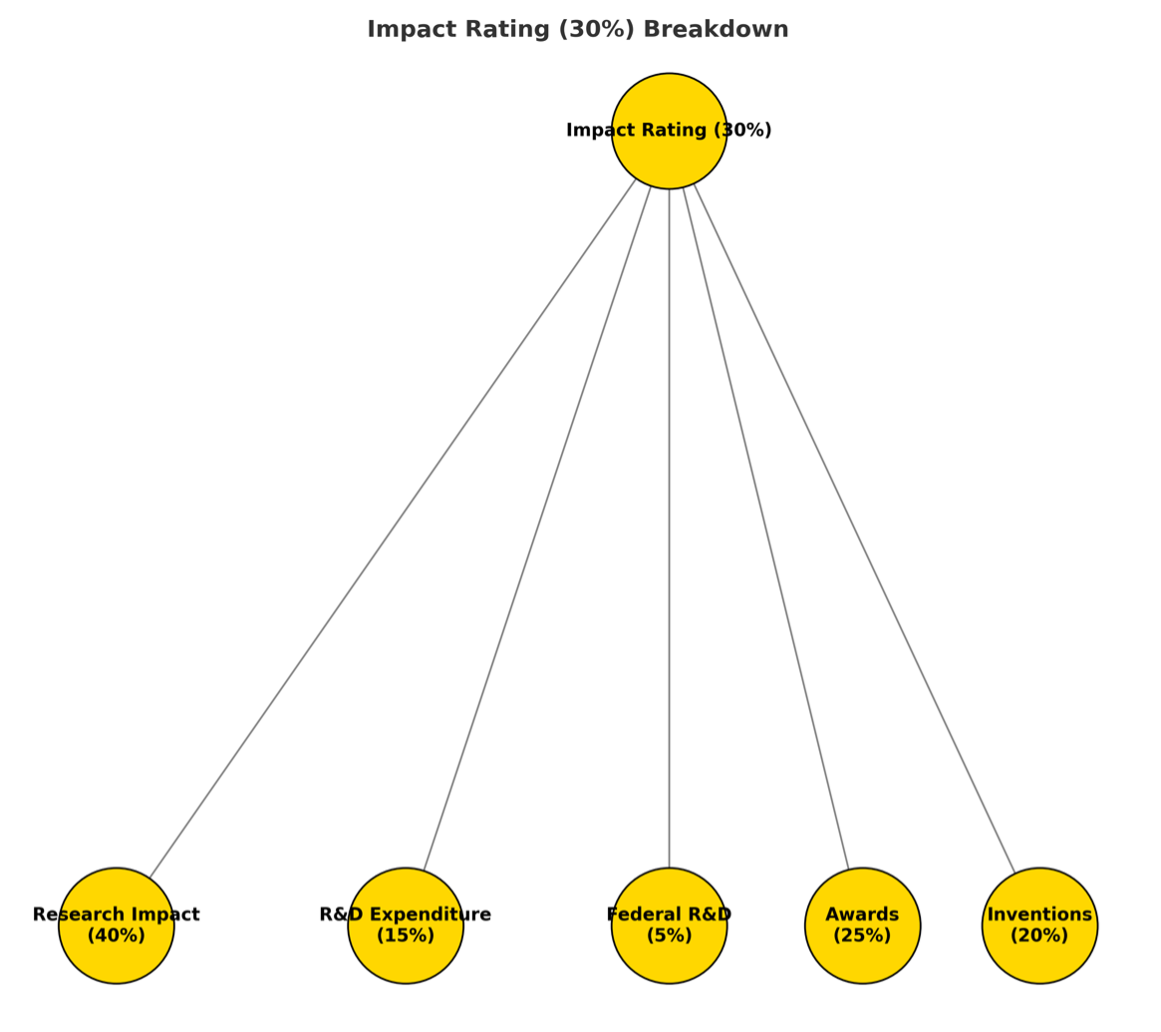
This metric combines the institutional data in five dimensions—Research Impact, non-funding R&D, Federal R&D, Awards, and Inventions—into a composite metric representing overall research strength and innovation potential. The metrics each have a weight based on importance: 40% research impact, 10% non-federal R&D, 5% federal R&D, 25% honors and awards, and 20% inventions. The final composite metrics were adjusted based on the available data for each school so that schools that had missing inputs were not penalized.
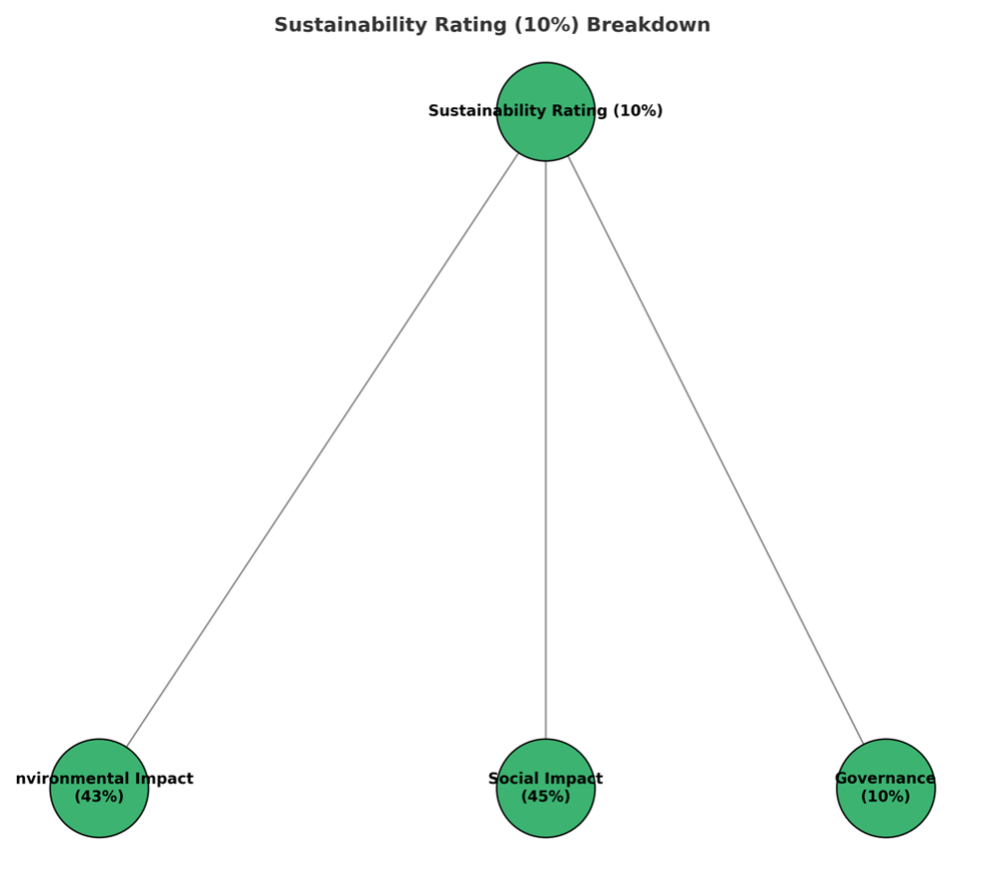
Sustainability (10%): This dimension assesses an institution’s potential for long-term perseverance: the process by which its operations, research, and engagement with society can adaptively reflect environmental and social priorities. With the QS World University Rankings: Sustainability report as a basis, it evaluates institutions’ sustainable development, contributing to environmental impacts (e.g., emissions, sustainable infrastructure), social impacts (e.g., equity, health, knowledge-exchange), and institutional governance.
Every metric was rated, normalized (on a 0-100 scale), and compiled into a composite index. Institutions were then ranked from the most resilient to the least resilient institution.
This weighted model provides a balanced rating of institutional resilience variables, ensuring that no single indicator is dominant within this composite measure.
Data Collection: Here is a breakdown of each variable and data sources. The financial-resources variables draw from the NACUBO-TIAA Study of Endowments (2024), IPEDS Data Center, and HERD Survey Data.
Prestige and influence were drawn from global university rankings (e.g., Times Higher Education World University Rankings data), global ranking data from QS World University Rankings data, and information on faculty honors (research databases for Nobel Prize Laureates, MacArthur Fellows Directory, Rhodes Scholar Directory, and National Academies Member Directory).
Public perception and relevancy were measured using alumni giving rates available from the Council for Aid to Education Voluntary Support of Education Survey data, available information about philanthropic foundation grant databases (Foundation Center), and media sentiment gathered when using media trackers such as American Caldwell.
Impact and innovation were measured based on patent filings available via the USPTO Patent Full-Text and Image Database (PatFT), the h-indices for faculty available through Scopus Author Search and Google Scholar Profiles; and major research grants from data from the NIH RePORTER, NSF Award Search, and European Research Council grants databases and private foundations such as the Bill & Melinda Gates Foundation Grant Database.
The elasticities to the losses were gathered using program cut announcements and data pooled from IPEDS Completion and Enrollment data (IPEDS Data Center) and state and federal government budget reports available from USAspending.gov and press releases.
Data Cleaning and Normalization: All raw data were cleaned for consistency (e.g., endowments were adjusted to 2025). Missing data for some institutions were conservatively imputed using median values from peer groups. All variables were scaled on a 0-100 range using min-max normalization.
The Importance of Resilience: Over the past year alone, we have seen public and private universities terminate programs and reduce staff or even reorganize. Recent financial challenges have led to program cuts in Indiana, with Indiana University cutting 249 programs, Purdue 83, and other institutions collectively totaling approximately 408 cuts. Stanford University also faces budget cuts of $140 million and a proposed endowment tax. These stories exemplify that large institutions are certainly not exempt from external pressures. However, what this analysis may suggest is that some universities have a better capacity to digest objective tensions, because of their positive financial capabilities, robust intellectual productivity, brand loyalty, and favorable public trust.
Barron’s reported that endowment performance for Michigan State was at 15.1%, with Wisconsin at 14.7% and Minnesota at 13.5%. The average for the Ivy League was about 9.4%. Harvard’s university endowment was estimated at $53.2 billion for FY 2023-24. Other endowments for the same period were the UT System ($47.5 billion), Yale ($41.4 billion), and Stanford ($36.5 billion). Some additional data on endowments for other institutions was obtained from the NACUBO-Common Fund Endowment Study (2024). The Counter-Spectrum: When Endowments Become Life Support
The resilience index that follows reveals part of the answer. The remaining part—how the lower end of the range looks when the institutions do not have capital reserves, a research pipeline, or a brand—is told in a rather forthright manner in the last twelve months of business-press reporting. The lower end of the higher education landscape in America can no longer be described in terms of the pressure on the colleges to reduce their tuition fees or of reducing the number of students. It can nowadays be characterized by institutions transforming the donor-created, permanent endowment capital into a short-term working fund by the institutions.
The situation is now conclusively revealed. As reported by The Wall Street Journal, almost 200 independent nonprofit colleges took out loans against their restricted endowments in 2025, compared to 131 institutions four years before. Moreover, the number of colleges withdrawing more than 7 percent of their endowment assets has increased significantly during the previous decade. A related article in The New York Post described the same facts in terms of their alarming implications. The Chronicle of Higher Education has even issued a simple warning to universities in dire financial need against excessive withdrawals from the endowment funds.
Three case studies are the basis of knowledge in the sector concerning the consequences of governance running to its end. Wisconsin Public Radio reported on Northland College, where inter-fund borrowing from restricted endowment started in 2012. As of June 2024, the university still owed around $22.1 million from borrowing internally. In April 2026, after Northland College announced financial exigency and ceased to operate, the amount of money in the remaining endowment fund dropped to $3.35 million. The reconstruction made by University Business Company proved that the university did not always keep track of the fund being used when the borrowing was made. In May 2025, the state attorney general in Ohio claimed the former administration of Notre Dame College misused over $2 million of restricted funds. At Hampshire College, the closure of the campus was announced in April 2026, made public by Inside Higher Ed, and later reported by the Boston Globe among other college closures in the New England region.
The causes of hardship are structural factors within the economy. The Federal Reserve Bank of Boston has carefully documented the demographic disruption chain, while Fortune magazine has shown how the drop in the birth rate following 2008 caused a big drop in enrollment numbers. NPR estimated how many private institutions of higher learning are dangerously close to shutting down. The negative outlook on the sector by S&P Global Ratings for 2026 explains how the ensuing margin compression causes issues with credit ratings for small nonprofit educational establishments. The institutions in difficulty that use their endowments to deal with the problem of financial shortfalls prevent themselves from fixing their primary problem since they only trade long-term capital for cash flow.
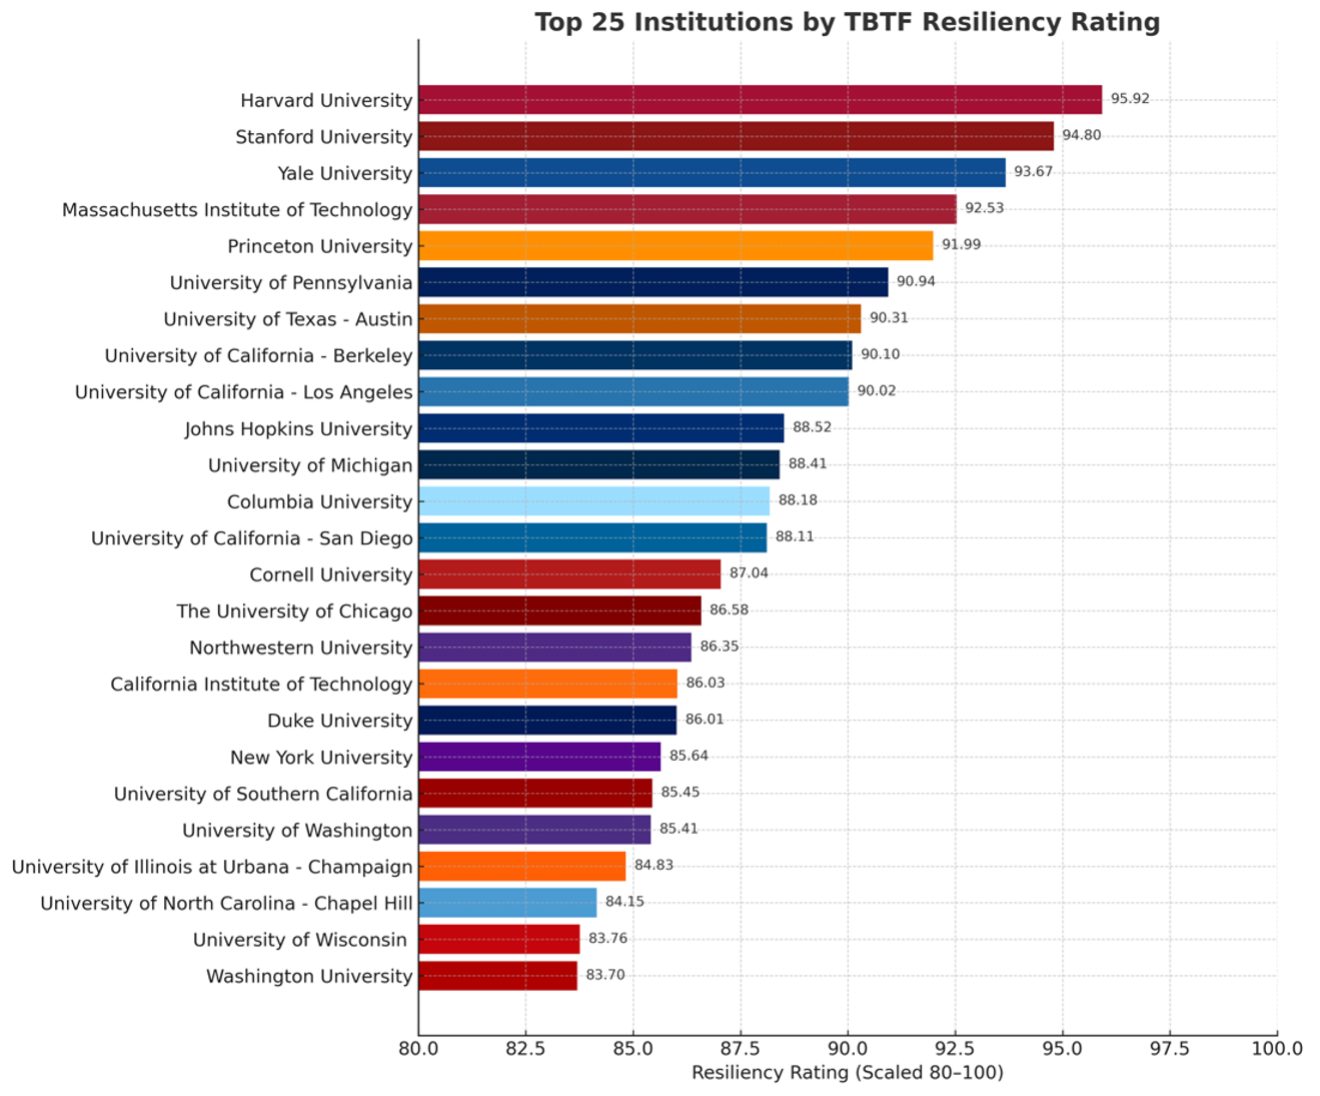
The connection to this matter is direct. The 24 organizations ranked first in the resilience list have the capital sophistication, research funding variety, and brand strength that protect them from the downside cycle hitting the unlucky ones. They are, strictly speaking, systemically protected. The trustees who know how to keep this opportunity open are the ones fulfilling their duty, which does not need to be performed by the systemically protected organizations anymore.
Snapshot: The Most Resilient Institutions
The following institutions are considered too big to fail, presented in descending order of composite resiliency score. Each institution’s five underlying dimension ratings are listed alongside the overall score:
- Harvard University — Resiliency Rating: 95.92
Financial Resource: 99.9
Prestige: 95.5
Brand: 99.9
Impact: 96.7
Sustainability: 78.6
- Stanford University — Resiliency Rating: 94.80
Financial Resource: 94.9
Prestige: 96.4
Brand: 99.7
Impact: 92.5
Sustainability: 95.6
- Yale University — Resiliency Rating: 93.67
Financial Resource: 96.9
Prestige: 93.1
Brand: 99.3
Impact: 92.9
Sustainability: 83.0
- Massachusetts Institute of Technology — Resiliency Rating: 92.53
Financial Resource: 90.0
Prestige: 96.6
Brand: 99.8
Impact: 91.1
Sustainability: 94.0
- Princeton University — Resiliency Rating: 91.99
Financial Resource: 95.4
Prestige: 94.6
Brand: 96.2
Impact: 90.6
Sustainability: 76.9
- University of Pennsylvania — Resiliency Rating: 90.94
Financial Resource: 88.0
Prestige: 92.4
Brand: 98.5
Impact: 90.7
Sustainability: 95.2
- University of Texas – Austin — Resiliency Rating: 90.31
Financial Resource: 98.8
Prestige: 83.2
Brand: 98.0
Impact: 90.0
Sustainability: 71.7
- University of California – Berkeley — Resiliency Rating: 90.10
Financial Resource: 80.6
Prestige: 93.1
Brand: 98.8
Impact: 94.8
Sustainability: 98.8
- University of California – Los Angeles — Resiliency Rating: 90.02
Financial Resource: 89.8
Prestige: 88.6
Brand: 98.9
Impact: 93.5
Sustainability: 78.8
- Johns Hopkins University — Resiliency Rating: 88.52
Financial Resource: 84.1
Prestige: 89.1
Brand: 96.6
Impact: 90.3
Sustainability: 93.3
- University of Michigan — Resiliency Rating: 88.41
Financial Resource: 86.8
Prestige: 88.5
Brand: 99.0
Impact: 91.9
Sustainability: 78.0
- Columbia University — Resiliency Rating: 88.18
Financial Resource: 85.0
Prestige: 90.4
Brand: 99.4
Impact: 91.7
Sustainability: 78.7
- University of California – San Diego — Resiliency Rating: 88.11
Financial Resource: 89.8
Prestige: 84.1
Brand: 97.5
Impact: 92.2
Sustainability: 73.3
- Cornell University — Resiliency Rating: 87.04
Financial Resource: 83.4
Prestige: 91.1
Brand: 99.5
Impact: 89.7
Sustainability: 77.6
- University of Chicago — Resiliency Rating: 86.58
Financial Resource: 83.4
Prestige: 90.1
Brand: 98.2
Impact: 90.1
Sustainability: 74.3
- Northwestern University — Resiliency Rating: 86.35
Financial Resource: 84.9
Prestige: 86.5
Brand: 96.4
Impact: 90.0
Sustainability: 75.3
- California Institute of Technology — Resiliency Rating: 86.03
Financial Resource: 82.1
Prestige: 92.8
Brand: 92.0
Impact: 87.1
Sustainability: 80.0
- Duke University — Resiliency Rating: 86.01
Financial Resource: 84.1
Prestige: 86.1
Brand: 97.3
Impact: 88.8
Sustainability: 78.4
- New York University — Resiliency Rating: 85.64
Financial Resource: 82.1
Prestige: 80.5
Brand: 98.6
Impact: 89.1
Sustainability: 91.6
- University of Southern California — Resiliency Rating: 85.45
Financial Resource: 83.1
Prestige: 79.6
Brand: 97.6
Impact: 87.8
Sustainability: 92.4
- University of Washington — Resiliency Rating: 85.41
Financial Resource: 84.2
Prestige: 82.7
Brand: 97.8
Impact: 89.8
Sustainability: 75.8
- University of Illinois at Urbana–Champaign — Resiliency Rating: 84.83
Financial Resource: 81.4
Prestige: 82.7
Brand: 96.5
Impact: 90.9
Sustainability: 76.8
- University of North Carolina – Chapel Hill — Resiliency Rating: 84.15
Financial Resource: 81.5
Prestige: 78.8
Brand: 96.1
Impact: 88.7
Sustainability: 84.5
- University of Wisconsin — Resiliency Rating: 83.76
Financial Resource: 81.1
Prestige: 79.7
Brand: 96.8
Impact: 90.8
Sustainability: 73.5
- Washington University in St. Louis — Resiliency Rating: 83.70
Financial Resource: 84.2
Prestige: 79.2
Brand: 93.0
Sustainability: 86.3
These schools are unrivaled not only in capital but also in research productivity, innovation, and agility; hence, they possess many attributes that make them some of the most resilient in US higher education. According to the results, private or elite institutions, such as the Ivy League, will all be near the top of their cohort with access to great wealth and the capacity for innovation. The list continues to rank public institutions such as UC Berkeley, the University of Michigan, and the University of North Carolina-Chapel Hill.
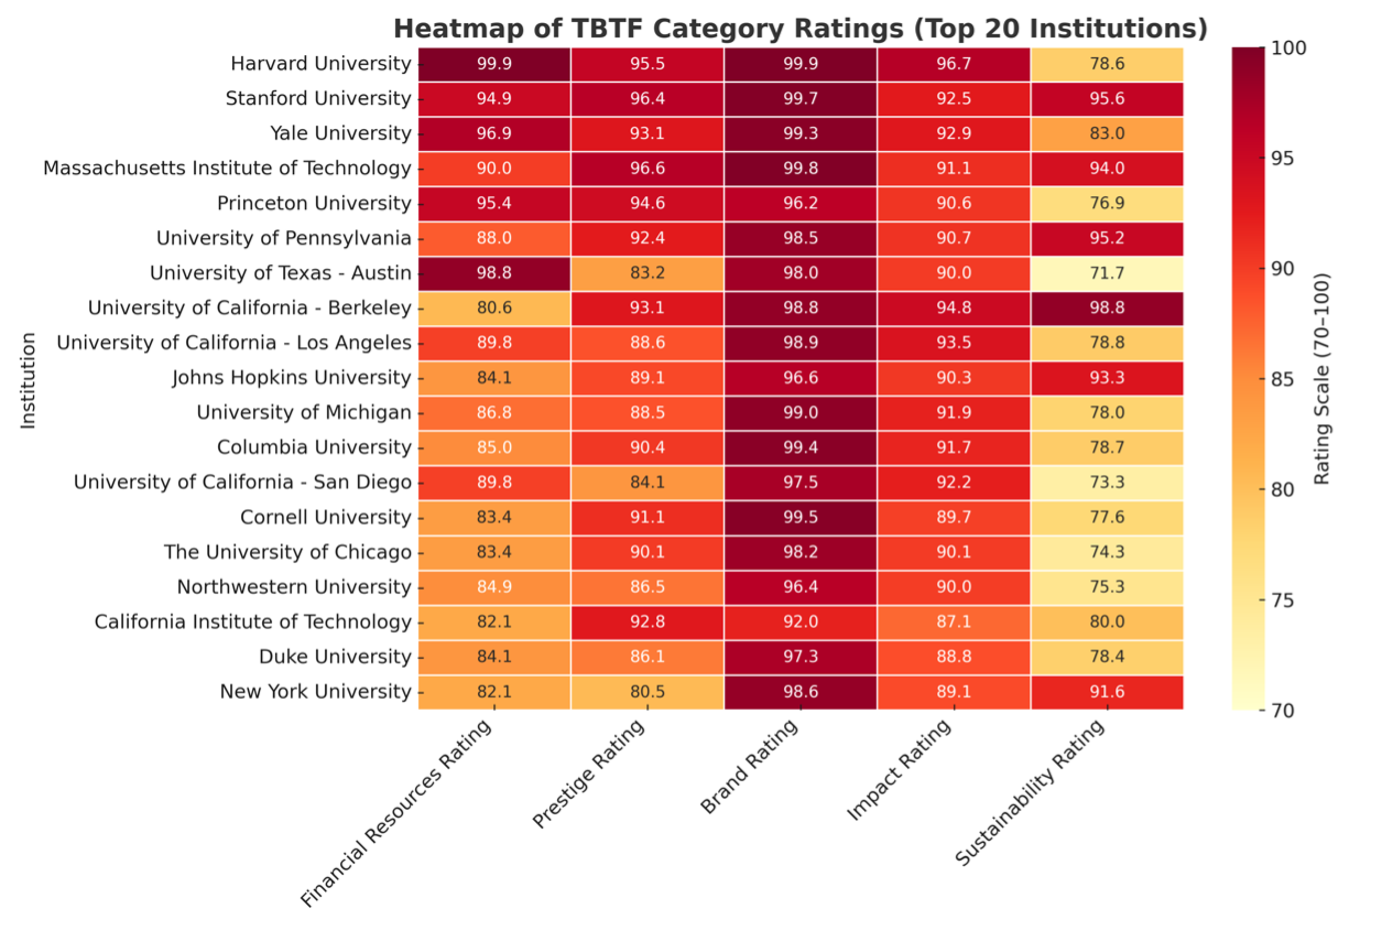
Here is a snapshot of the most resilient institutions:
Some institutions have relative dips with Sustainability or Brand scores, which point to potentially growing or differentiating improvements with the institution. The scale is from 70 to 100; an advantage of this rating system is that there are nuanced comparisons to be made between institutions, even among highly ranked institutions. Overall, the heatmap reveals the category-level strengths contributing to top universities’ overall composite resiliency.
Assumptions and Limitations:
The assessments in this analysis rely on various assumptions and limitations. Regarding the nature of this composite rating, rankings may vary if the weights were selected differently. Also, owing to standardized data limitations, budget cuts, hiring freezes, and layoffs are not considered in this measure because there are several reasons why an institution might cut costs through these activities. Cuts and layoffs are often a forward-thinking way to improve efficiencies, either in the context of significant change in the marketplace or even as an outright measure of distress. Budget cuts, hiring freezes, and layoffs may have their benefits when viewed as significant and with governmental support, but significant budget cuts and layoffs will affect their models and operations by calling into question their regulatory environment, their market position in terms of stability, and their operational envelope.
This analysis excludes the Pulitzer Prize and Fields Medal because both emphasize the prominence of the individual over the resilience of institutions or systems at scale, with some inconsistency in university attribution, and given that many recipients are affiliated with non-academic bodies or post-docs make it highly unclear if they can even be considered institutional outputs. An emphasis remains on an institution’s continuous output, the size of their endowment, and their influence on research nationally.
When individual dimension scores are not provided for certain institutions, the composite resiliency rating is calculated based on other available dimensions by reallocating the weight of the missing dimension score proportionally in the remaining categories, which is consistent with the fairness adjustment already described in the methodology. The case of Washington University in St. Louis is presented in this instance, where its Impact score could not be computed, and a composite score of 83.70 has been calculated accordingly.
Finally, the rankings are a composite measure of resilience for a given institution that reflects financial, reputational, innovative, and adaptive ability, rather than a direct measure of absolute quality or student experience.
Final Thoughts: No university is truly invincible. However, the evidence suggests that the institutions leading this highest resilience indicator have potentially developed the reputations, financial and intellectual capital to be resilient, even in contexts of systemic shocks. As the landscape of higher education continues to evolve, the institutions at greatest risk will keep an eye out to see which schools demonstrate adaptability and which find themselves vulnerable to rupture in an increasingly competitive environment.